
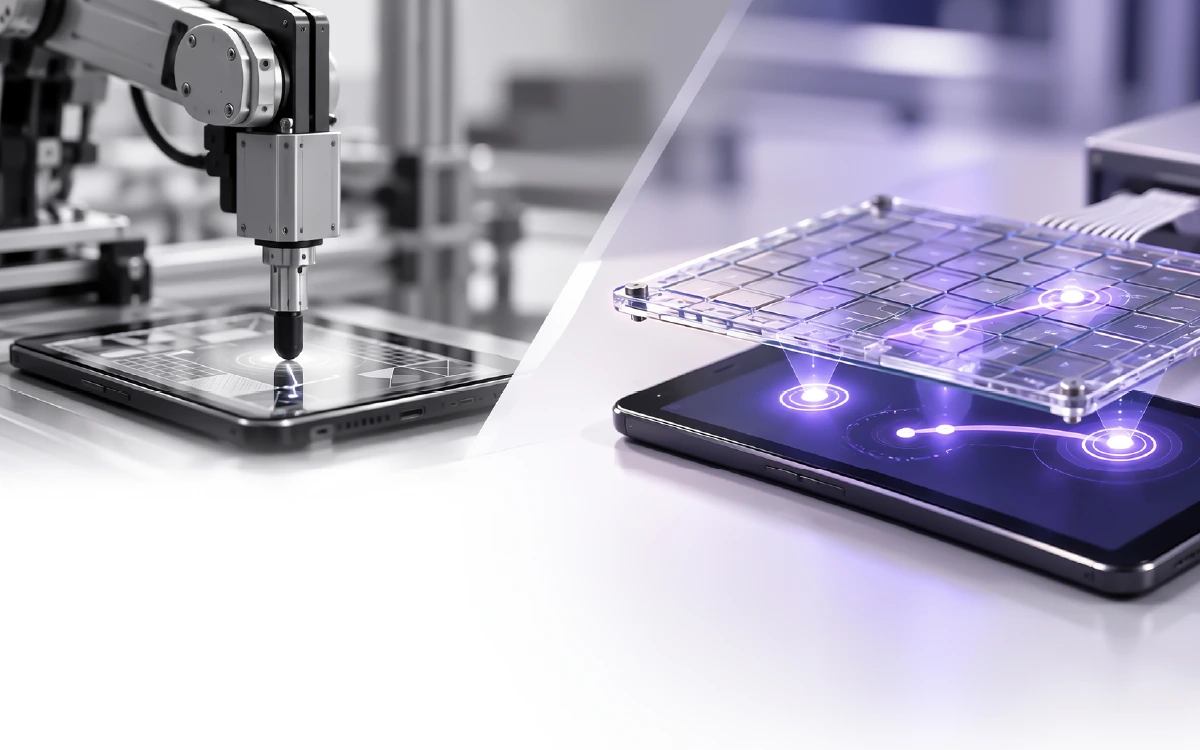
REAL TOUCH. REAL APPLICATIONS. MEASURABLE PERFORMANCE.
A scalable platform for programmable touch and gesture generation, endurance testing and end-to-end response analysis - without moving touch actuators.
Executive Summary
As touch-driven products become more software-intensive, validation must go beyond basic sensor operation to cover application behavior, gesture handling, endurance and end-to-end responsiveness. Conventional test automation typically relies on robotic fingers, styluses or XY mechanisms. While these systems reproduce physical contact, they also introduce mechanical wear, motion constraints, setup complexity and maintenance requirements.
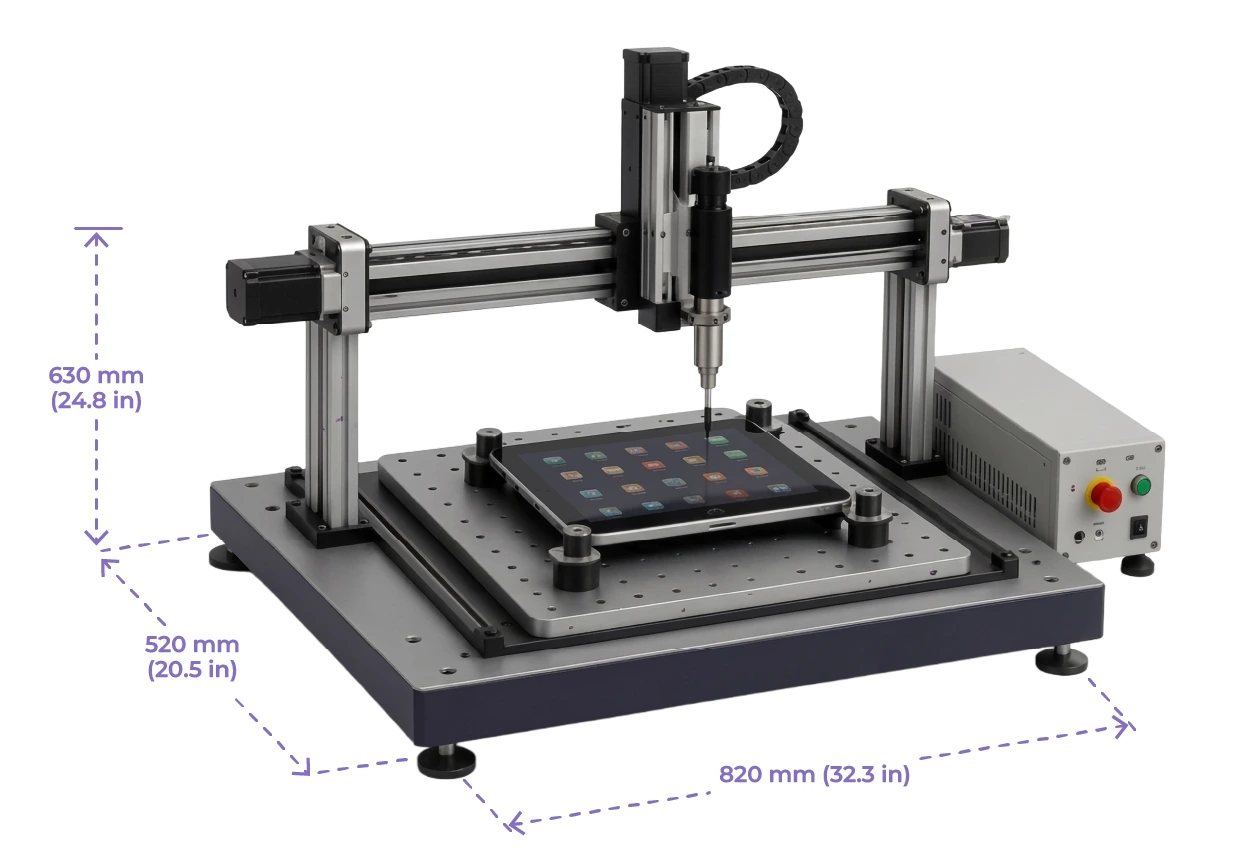
Figure 1. Conventional robotic touch screen test system
The Capacitive Touch HIL Test Platform replaces mechanical touch actuation with a solid-state approach. A thin active matrix is positioned against the touch surface of a real device under test (DUT). Individually addressable elements produce localized capacitive stimuli that the PCAP controller interprets as touch input. Test software can activate individual elements for taps and presses, sequential elements to generate trajectories, or multiple elements simultaneously for multi-touch behavior. No moving actuator is required.
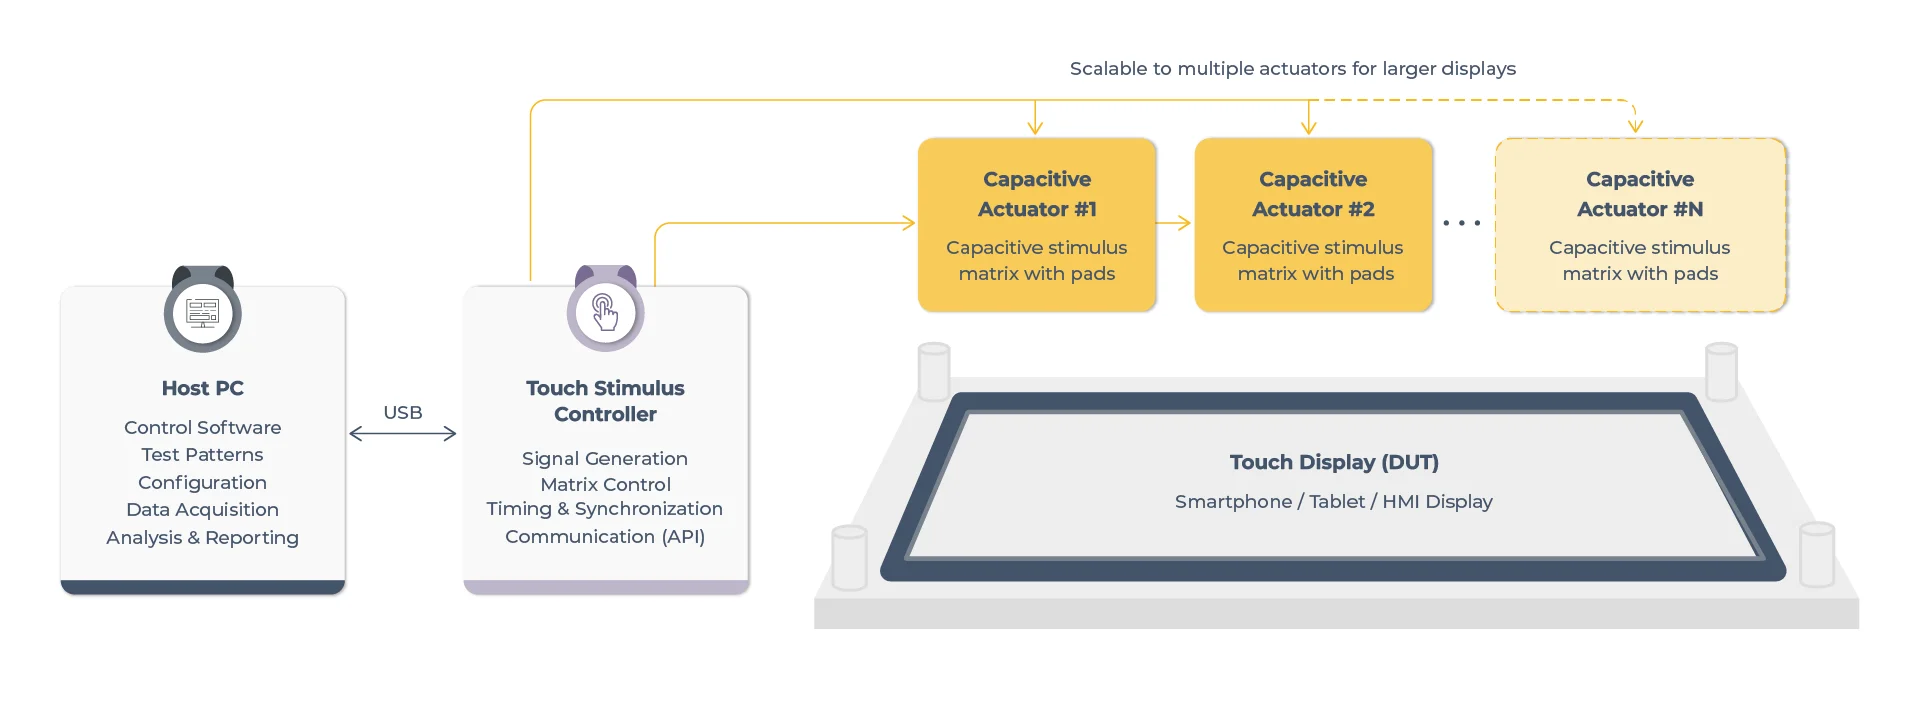
Figure 2. Capacitive touch HIL test platform concept
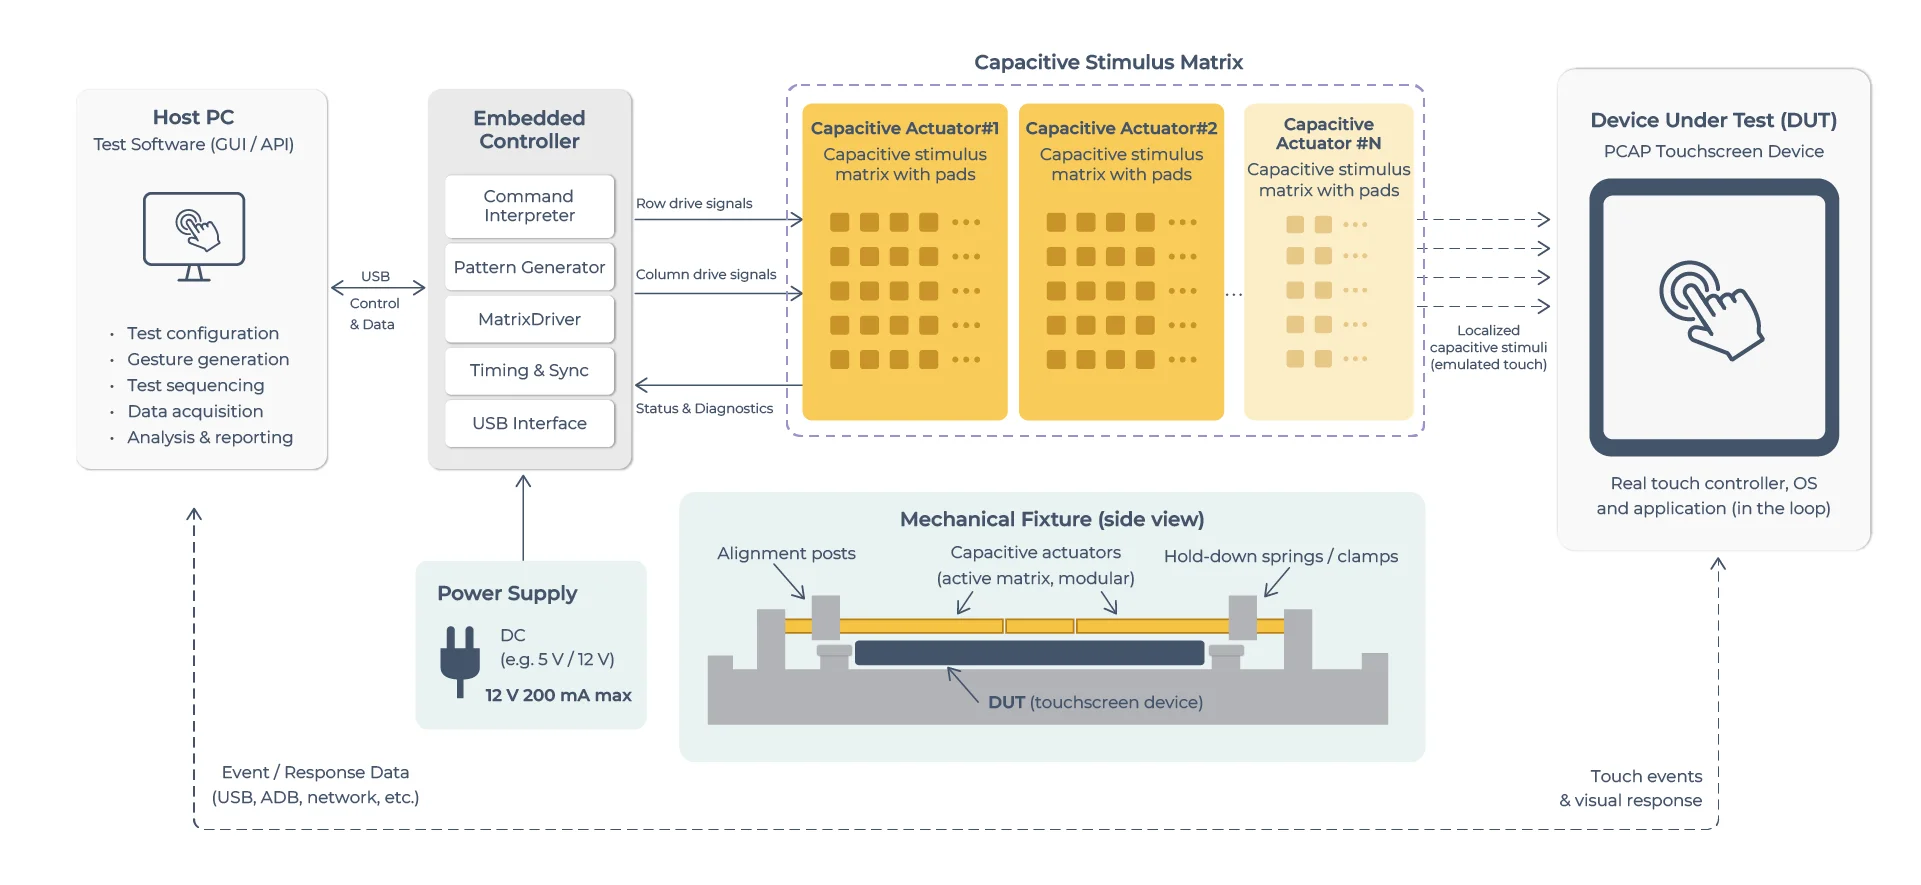
Figure 3. Capacitive touch HIL test platform detailed
The current engineering prototype uses a 16 × 25 matrix with an 8 mm pitch and supports customizable element geometry. Its control architecture can change activation state on the order of 100 microseconds, while the actual touch duration is programmable and configured to match the scan rate, filtering and persistence requirements of the target display. A USB-connected embedded controller provides GUI and API access and automated reporting, with Python support planned.
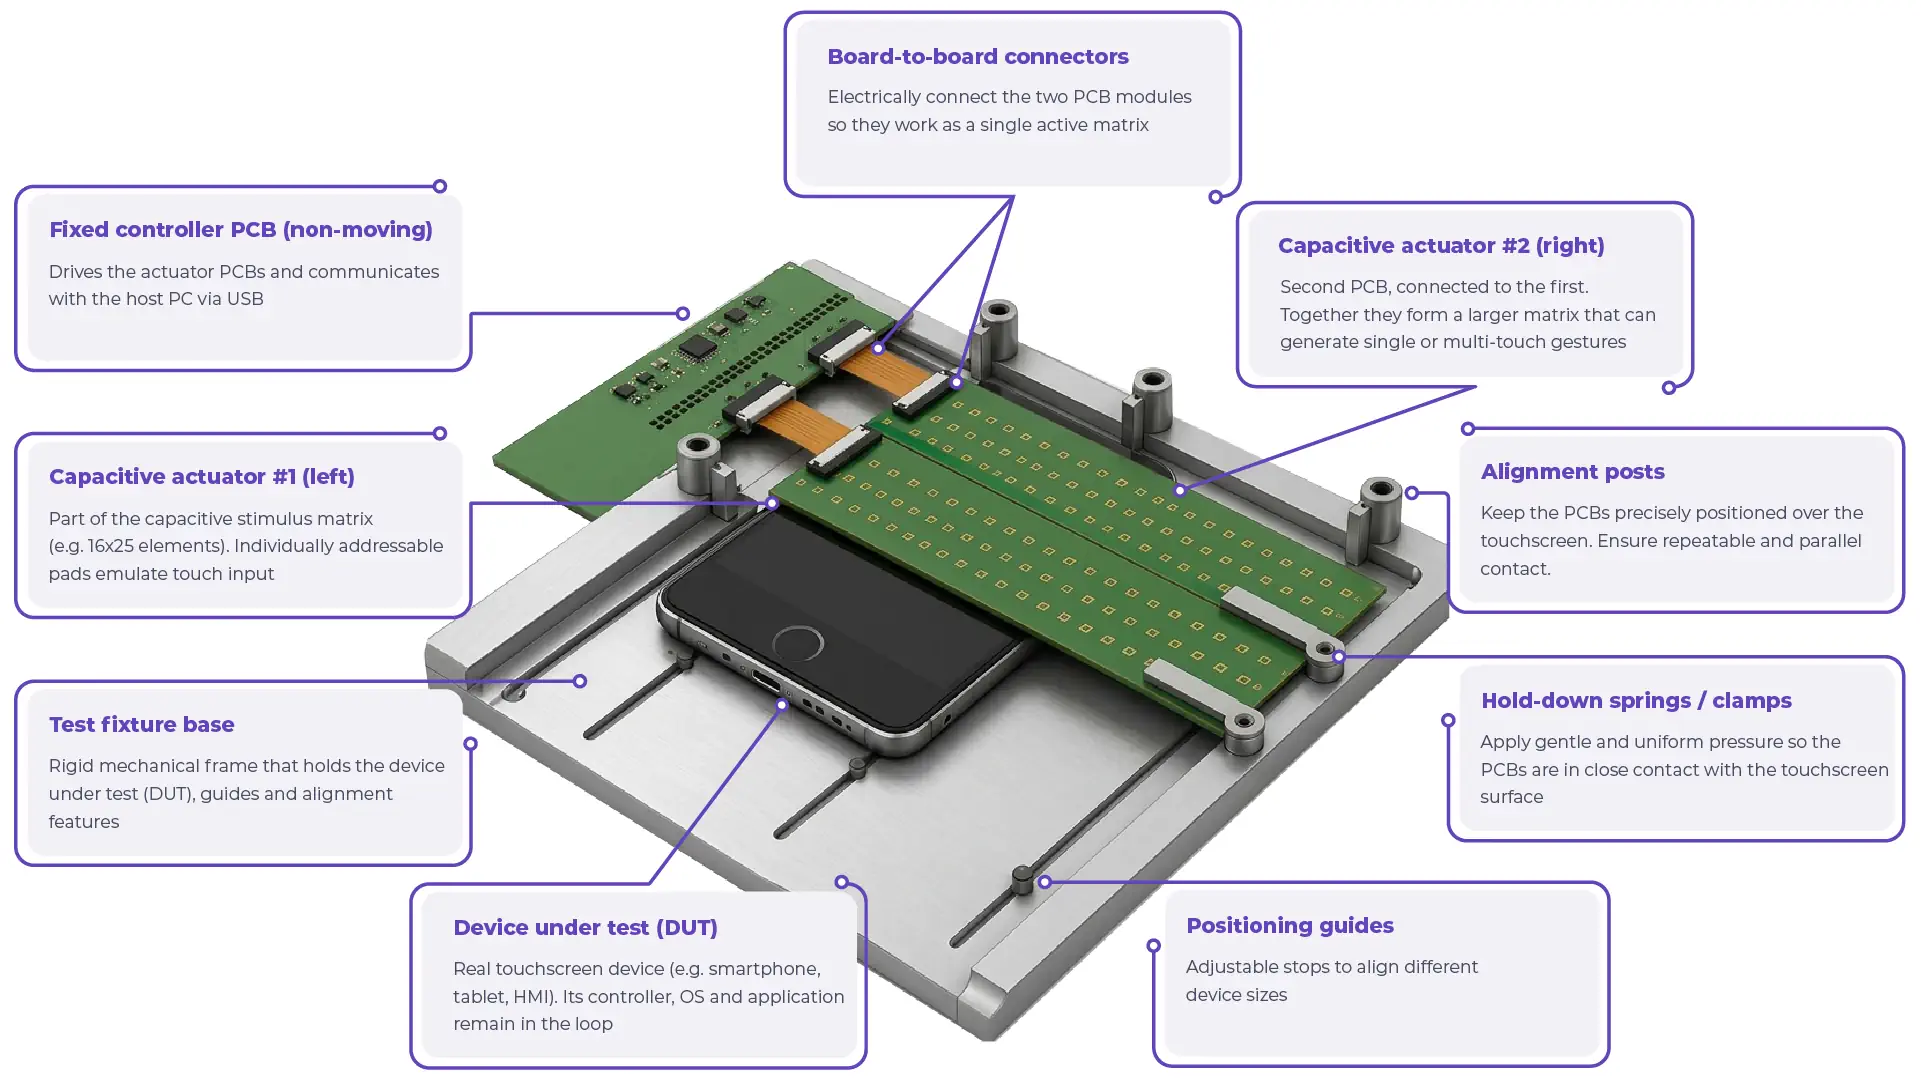
Figure 4. Current engineering prototype
Initial trials have been performed on a smartphone, a tablet and a large touch display. Across hundreds to several thousand prototype actuations, no missed touch events were observed under the tested conditions. These results demonstrate technical feasibility but do not yet constitute a qualified reliability claim. Formal repeatability, timing accuracy and uncertainty, endurance, and cross-controller compatibility are the next validation priorities.
VALUE PROPOSITION
A programmable solid-state touch stimulus layer enables repeatable automated testing on the real device – from individual touches and multi-touch gestures to long-duration endurance testing and end-to-end response measurement – without mechanical actuation.
The Need for Better Touchscreen Testing
PCAP controllers detect touch by continuously scanning an electrode structure for local changes in capacitance. But touch performance depends on the complete system, not the sensor alone. Cover-glass thickness, bonding, grounding, enclosure design, electrical noise, controller tuning and firmware filtering can all affect sensitivity, false-touch behavior and positional accuracy. Effective validation therefore requires the complete product stack, not just the bare panel.
A complete validation strategy must answer several different questions:
- Does every required region of the interface register a touch?
- Are taps, long presses, swipes and multi-touch gestures interpreted correctly?
- How does performance change over thousands or millions of repetitions?
- What is the latency from commanded stimulus to the operating-system event and visible application response?
- How consistent are the results across devices, environmental conditions and controller settings?
Hardware-in-the-loop testing connects real hardware and interfaces to a controlled test environment where system behavior can be stimulated, observed and automated. In this platform, the real touchscreen, touch controller, operating system and application remain in the loop. Only the physical touch actuator is replaced – by a programmable capacitive stimulus.
From mechanical actuation to solid-state testing
| Constraint | Typical mechanical approach | Solid-state approach |
|---|---|---|
| Motion and settling time | An actuator must travel, contact and retract. | Electronic selection eliminates physical travel. |
| Wear | Tips, guides, bearings and fixtures require maintenance. | No moving touch actuator. |
| Parallel actuation | Synchronized multi-touch requires multiple axes or tools. | Multiple matrix elements can be activated simultaneously. |
| Long-duration testing | Mechanical drift and wear can affect repeatability. | Static geometry supports extended automated runs. |
| Form-factor changes | Fixtures and motion paths may require rework. | Matrix geometry and carrier can be customized. |
Table 1. Typical mechanical approach vs solid-state approach
Platform Concept
The platform is designed primarily for projected capacitive (PCAP) displays. Its active panel contains individually addressable capacitive elements. During actuation, a selected element is electronically coupled to ground, creating a controlled local change in the capacitive field at the touch surface. The DUT touch controller detects this change and reports one or more coordinates through its normal interface.
Reliable capacitive coupling requires controlled mechanical placement. The active panel is positioned flat against the display or with a uniform gap of approximately 0.3 mm. Air gaps, surface curvature, cover-lens thickness and controller sensitivity affect coupling strength and may require adaptation of element geometry, grounding and actuation duration.
HIL signal loop
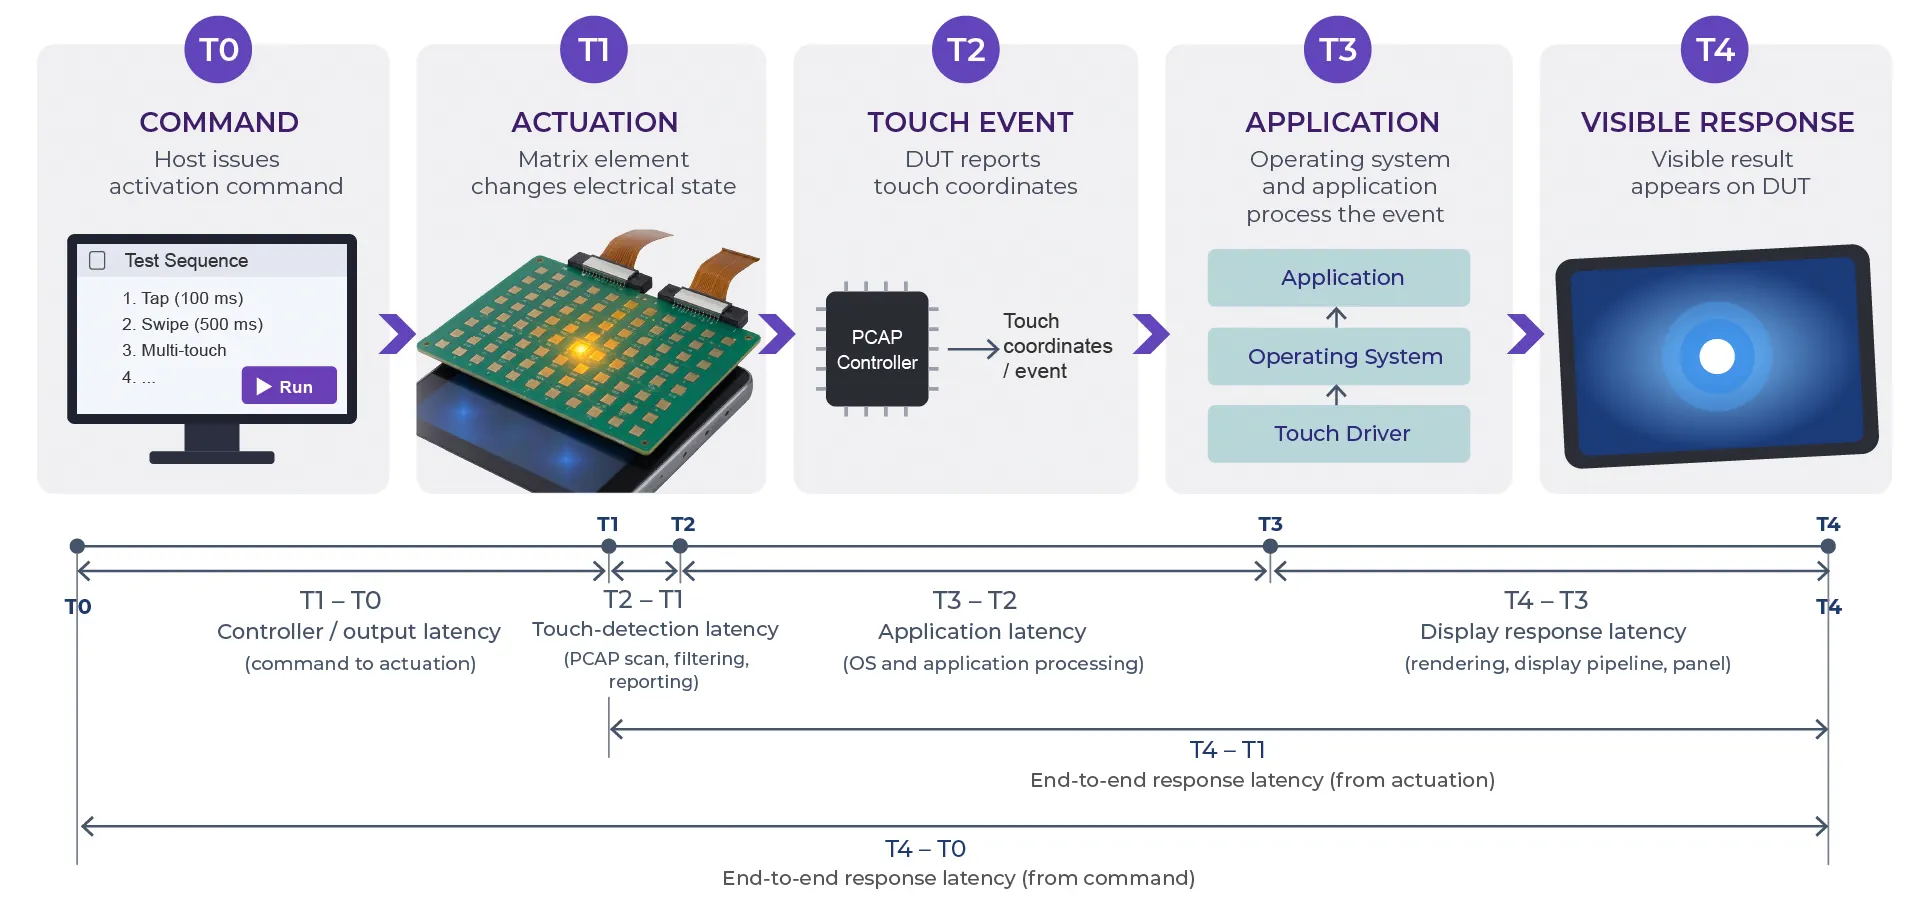
Figure 5. Platform concept – HIS signal loop
System Architecture
The prototype architecture combines a host-side automation layer, a USB-connected embedded controller, scalable serial output logic, an active touch matrix and multiple response-acquisition paths.
| HOST PC / AUTOMATION | EMBEDDED CONTROL | ACTIVE INTERFACE | DEVICE UNDER TEST | MEASUREMENT |
|---|---|---|---|---|
| GUI, API, scripts and report generation | Command decoding, sequence timing and matrix drive | 16 x 25 addressable capacitive elements | PCAP panel, controller, OS and application | USB events, camera or screen capture |
Table 2. Platform concept – system architecture
Host software
The host environment provides a graphical user interface and API for test configuration and execution. Test scenarios can be defined as ordered command sequences containing element coordinates, activation duration, delay, simultaneous activation groups and repetition count. Results can be stored in configurable formats and consolidated into automatic reports. Planned Python support will enable integration with laboratory workflows, regression frameworks and continuous-test environments.
Embedded control
An embedded controller running embedded C firmware receives commands over USB and drives the matrix through a scalable serial-output architecture. In the current design, the hardware can change activation state on the order of 100 microseconds. This switching capability should not be interpreted as the minimum touch duration accepted by a DUT. Effective stimulus duration is configured according to the target controller’s scan period, filtering and touch-validation thresholds.
Response acquisition
The platform supports complementary response-measurement paths. USB event capture identifies when the host receives a touch report and currently provides approximately millisecond-level timestamping. A camera captures the physical visible response, with temporal resolution determined by its frame rate. Screen capture or wireless mirroring can simplify automated visual analysis but may introduce transport and buffering delays. These methods should therefore be treated as complementary measurement paths rather than substitutes for direct optical observation.
Active Touch Matrix
| Parameter | Current prototype / design intent |
|---|---|
| Target interface | Projected capacitive (PCAP) touchscreen |
| Matrix configuration | 16 rows x 25 columns, 400 addressable elements |
| Element pitch | 8 mm nominal in both axes |
| Typical element size | Customizable, approximately 5 x 5 mm to 8 x 8 mm |
| Mechanical interface | Flat placement against the touch surface; recommended gap <= 0.3 mm |
| Simultaneous activation | Multiple elements, pattern defined by the test sequence |
| Activation-state switching | Approximately 100 microseconds technically available; effective touch duration is DUT-dependent |
| Display size | Current prototype demonstrated on displays up to approximately 18 inches; geometry is customizable |
| Controller connection | USB |
| Software access | GUI and API; Python support planned |
| Reporting | Automatic, configurable output formats |
Table 3. Current prototype – active touch matrix
The 16 × 25 configuration and 8 mm pitch define the current prototype, not a fixed platform limit. Larger or smaller versions can be produced by adapting the matrix dimensions, element geometry and mechanical carrier. Coverage dimensions and the relationship between nominal display size and fully covered active area should be specified for each productized configuration.
Coupling strength and adaptation
Stimulus strength can be adjusted through element geometry and the electrical path to ground. Larger elements generally provide stronger capacitive coupling but reduce spatial granularity; smaller elements improve granularity but may require tighter placement and greater DUT sensitivity. Because PCAP controllers vary in drive frequency, filtering, sensitivity, palm rejection and cover-glass compensation, qualification should include a calibration profile for each DUT family.
Touch and Gesture Generation
Beyond individual touch events, the platform can generate spatial and temporal activation patterns that the DUT interprets as gestures.
Active Capacitive Panel
Turns any addressable point into a touch instantly.
Successive touch activation create a continuous gesture.
Two simultaneous touch activations create a virtual touch point at their midpoint.
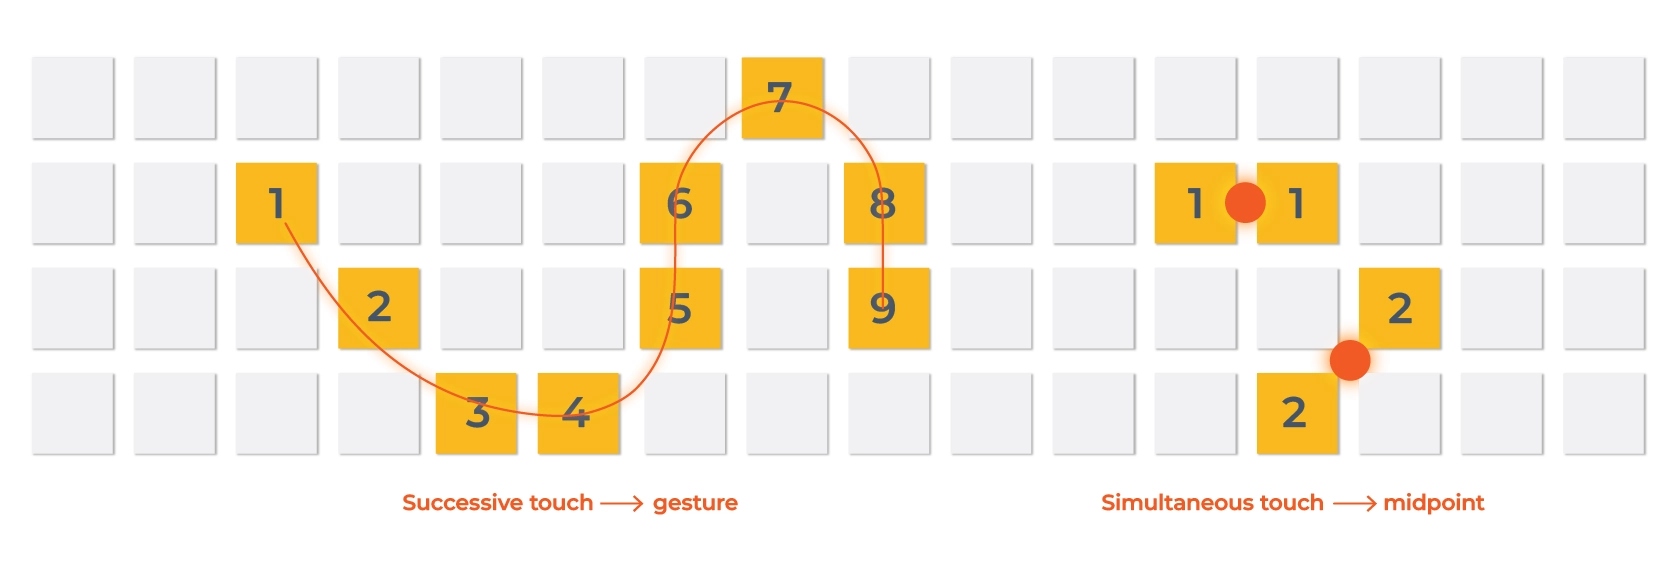
Figure 6. Gesture and simultaneous touch
| Test action | Activation strategy | DUT interpretation |
|---|---|---|
| Tap / press | Activate one element for a defined duration. | Single touch event |
| Repeated tap | Repeat the same element with controlled on/off timing. | Debounce, responsiveness or endurance test |
| Swipe / drag | Sequentially activate adjacent elements along a programmed path. | Touch trajectory based on sequential points and controller interpolation |
| Long press | Hold one element active beyond the application threshold. | Press-and-hold action |
| Pinch / zoom | Run two coordinated trajectories toward or away from each other. | Multi-touch scale gesture |
| Rotate | Run two or more coordinated trajectories around a center. | Rotation gesture |
| Parallel touch | Activate multiple elements at the same time. | Multi-point input or combined capacitive response |
Table 4. Test action, activation strategy, and DUT interpretation
Successive activation and interpolation
A swipe is generated by successively activating neighboring elements. The DUT may report coordinates corresponding to the physical element centers, intermediate coordinates calculated by its controller, or a combination of both. The resulting trajectory depends on matrix pitch, sequence timing, touch persistence, and the DUT’s interpolation and filtering algorithms.
Simultaneous adjacent actuation
During prototype trials, simultaneous activation of two adjacent elements produced a reported coordinate between their physical centers. This behavior results from the combined capacitive stimulus and the touch controller’s coordinate-estimation algorithm and is therefore controller-dependent. It should not be assumed across all PCAP implementations. The current platform does not independently control the stimulus strength of adjacent elements to position an intermediate coordinate. Spatial granularity can instead be adapted through element geometry, pitch and activation patterns.
Latency and Response Measurement
A meaningful latency measurement requires clearly defined start and end points. The platform supports both event and visual-response measurement, allowing the timing chain to be separated into command, physical actuation, DUT detection, application processing and displayed response.
Figure 7. Latency and response: timing chain
Measurement resolution
USB event logging currently provides approximately 1 ms temporal resolution. Camera-based measurement is limited by frame rate: 33.3 ms per frame at 30 fps and 8.33 ms per frame at 120 fps. Optical measurement captures the visible display response but requires a synchronized reference or trigger to define T0 or T1 accurately. Screen mirroring can simplify automation but may introduce transport and buffering delays.
Recommended statistical output
- Activation success rate and missed-event count
- Minimum, maximum, mean, median, P95 and P99 latency
- Standard deviation and interquartile range
- Latency histograms and trends over cycle count
- Spatial success and latency heat maps
- Defined outlier criteria and retained raw event logs
Automation, Reporting and Data Use
The platform combines programmable touch generation with automated result collection and reporting. Users can define test points and sequences through the GUI or operate the platform programmatically through the API. Planned Python support will extend this workflow to scenario generation, test-batch execution, timestamp collection and custom analytics without firmware modification.
A typical scenario can contain:
- One or more matrix coordinates
- Activation and release times
- Delay between commands
- Simultaneous activation groups
- Trajectory and gesture sequence
- Repetition count and stop conditions
- Expected event, screen state or timing limit
Results can be retained in configurable formats and consolidated into automatic reports. A productized workflow can extend this capability with machine-readable raw data alongside human-readable summaries, supporting conventional pass/fail validation as well as longer-term trend and anomaly analysis.
Prototype Status and Initial Validation
An engineering prototype has been built and exercised on a smartphone, a tablet and an approximately 18-inch touch display. Testing ranged from hundreds to several thousand actuations under the evaluated setup conditions, with no missed touch events observed.
INTERPRETATION OF PRELIMINARY RESULTS
The results demonstrate technical feasibility under the tested conditions. They do not yet constitute a statistically qualified reliability claim. Device sample size, DUT configurations, placement conditions, actuation profiles and confidence bounds have not yet been formalized.
Next validation phase
| Phase | Objective | Recommended evidence |
|---|---|---|
| A. Element characterization | Verify every element and spatial uniformity. | Per-element success map and signal margin |
| B. Repeatability | Measure run-to-run variation. | Repeated-cycle testing with statistical variation analysis |
| C. Endurance | Demonstrate long-duration stability. | 100k to 1M cycles with trend analysis |
| D. Cross-DUT compatibility | Evaluate controller sensitivity differences. | Phone, tablet, industrial HMI and large display families |
| E. Gesture fidelity | Quantify trajectory and multi-touch behavior. | Coordinate traces and application outcomes |
| F. Timing metrology | Establish timestamp accuracy and uncertainty. | Synchronized trigger, event log and high-speed camera |
Table 5. Plan for next validation phase
Integration Considerations and Current Limitations
PCAP systems are not electrically identical. Differences in scan architecture, baseline tracking, sensitivity, noise filtering, palm rejection, cover-glass tuning and grounding can affect whether a given stimulus is detected and how coordinates are resolved. DUT sensitivity is therefore a key integration variable and may require adaptation of the matrix configuration and actuation parameters.
The following factors should be addressed during integration:
- Flatness and a repeatable gap of no more than approximately 0.3 mm
- Element size and pitch relative to the target screen and coordinate resolution
- Ground reference and electromagnetic environment
- Touch pulse duration relative to controller scan and debounce behavior
- Controller-dependent interpretation of simultaneous adjacent elements
- Camera synchronization and frame-rate limits for visible-response timing
- Definition of covered area for each display size and custom matrix
Together, these factors define the configuration and calibration workflow required to make test results repeatable and comparable across DUT families.
Scalability and Commercial Opportunity
The core concept separates test intent from physical motion. The platform can scale by adapting the number, geometry and arrangement of matrix elements together with the control architecture and mechanical carrier. This enables application-specific configurations for mobile devices, automotive and medical displays, industrial HMIs, kiosks and other PCAP-based interfaces.
| Use case | Platform value |
|---|---|
| Regression testing | Reproduce defined touch and gesture sequences across software builds and DUT configurations |
| Endurance testing | Execute long-duration touch campaigns without mechanical actuator wear |
| Gesture and application validation | Exercise taps, long press, swipes and multi-touch behavior on the real device and application |
| Response measurement | Correlate command stimulus, touch events and visible application response |
| Cross-DUT qualification | Apply comparable test scenarios across different device and controller families |
| Custom HMI validation | Adapt matrix geometry and test sequences to application-specific touch surfaces |
Table 6. Platform value for various use cases
The immediate collaboration opportunity is to select representative DUT families, define measurable acceptance criteria and develop application-specific matrix configurations. Pilot projects can accelerate compatibility characterization, timing validation and the transition from engineering prototype to a supported test platform.
Conclusion
The Capacitive Touch HIL Test Platform demonstrates a solid-state approach to automated PCAP interface testing. By replacing mechanical touch actuation with a programmable active matrix, it enables controlled touch and gesture generation, long-duration testing and response measurement while keeping the real touchscreen, controller, operating system and application in the loop.
The engineering prototype has demonstrated feasibility across a smartphone, tablet and approximately 18-inch touch display, with no missed touch events observed in the initial trials. The next phase is formal qualification through per-element characterization, repeatability and endurance testing, cross-controller calibration, gesture characterization and synchronized timing measurement.
The platform now provides a basis for pilot programs with device manufacturers, HMI teams, test laboratories and technology partners, including application-specific matrix configuration, integration and joint validation.
PILOT EVALUATION
RT-RK is seeking partners for pilot evaluation of the Capacitive Touch HIL Test Platform across representative PCAP devices, controllers and applications.
Appendix A. Preliminary Specification Summary
| Category | Preliminary value / capability | Status |
|---|---|---|
| Touch technology | Projected capacitive (PCAP) | Demonstrated |
| Actuation method | Localized capacitive stimulus through selectable coupling to ground | Demonstrated |
| Matrix | 16 x 25 elements | Prototype configuration |
| Pitch | 8 mm nominal | Prototype configuration |
| Element geometry | Approximately 5 x 5 mm to 8 x 8 mm | Configurable |
| Interface gap | Flat placement, recommended <= 0.3 mm | Integration requirement |
| Simultaneous points | Multiple, scenario-defined | Demonstrated |
| Activation-state switching | Approximately 100 microseconds; effective touch duration is DUT-dependent | Preliminary |
| Gestures | Tap, repeated tap, swipe, long press, pinch/zoom and rotate | Demonstrated / configurable |
| Host interface | USB | Demonstrated |
| Software access | GUI and API/Python | Demonstrated/Planned |
| Measurement | USB event capture; camera or screen observation | Demonstrated |
| Automated reporting | Configurable report generation | Demonstrated |
| Mechanical actuation | No moving touch actuator | Inherent characteristic |
| Display size | Demonstrated up to approximately 18 inches; customizable | Demonstrated/Configurable |
Table 7. Overview of the platform status over various categories
Document Notes
This document describes an engineering prototype and preliminary platform concept. Numerical timing values and performance limits are preliminary and should not be interpreted as product guarantees unless supported by a released specification and defined validation method. Interfaces and capabilities may change during development. Detailed electrical implementation is outside the scope of this document.